transient simulation
Transient heat flow simulation in SIMU-THERM 7.1
Transient simulation - main dialog
Heating schedule - total duration 55 hours
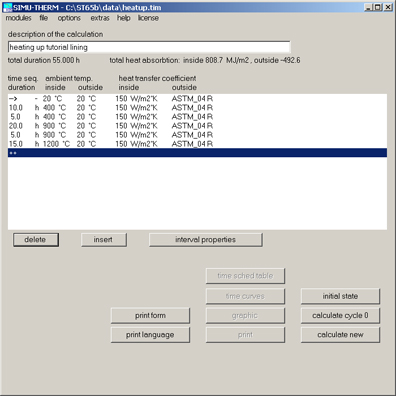
The ambient temperatures inside and outside are not constant (unlike in steady state)
They are given as curves over the time. The same holds for the heat transition coefficients.
Temperature profiles in the wall at different times
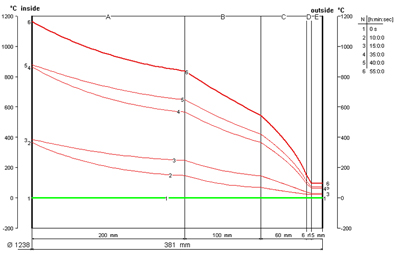
Green line: Initial temperature (cold)
Fat red line: Final temperature
Thin red lines: intermediate times
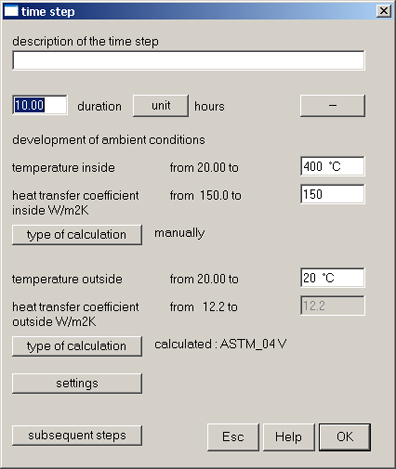
Time interval dialog
Selection dialog for time curves
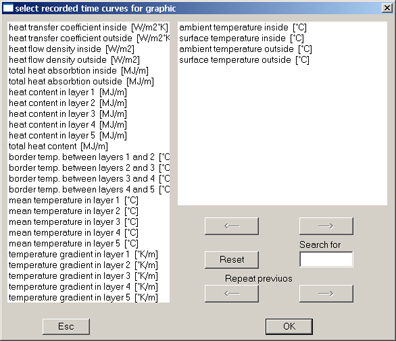
One or more figures recorded during the simulation are chosen for a graph over the time.
Time curves graph 1
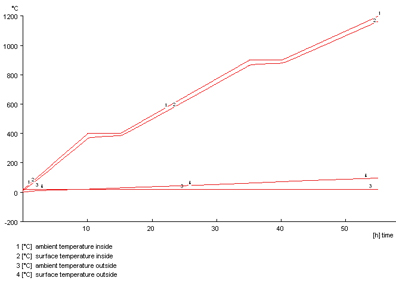
Here the following figures have been selected:
• Ambient temperature (= temperature defined in the heating schedule)
• Surface temperature inside
• Two of the temperature between wall layers
Time curves graph 2
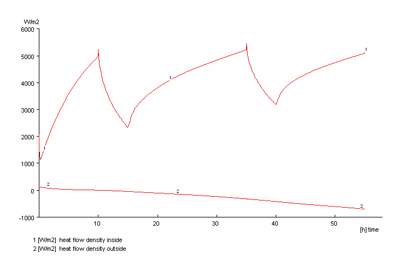
Here the following figures have been selected:
• Heat flow density inside W/m2 (= heat absorbed by the wall)
• Heat flow density outside W/m2 (= heat loss of the wall to ambient air)
Time curves graph 3
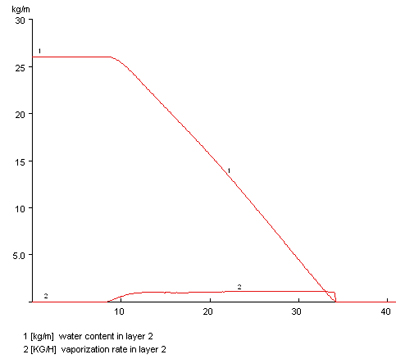
Here the following figures have been selected:
• Water content [kg] in layer 2
• Vaporization rate [kg/h] in layer 2
Layer 2 is dry after about 34 hours. The water is vaporized almost regularly.
